How to Run a Paid Search Experiment You Can Actually Trust
How to design a Google Ads experiment you can trust, choose the goal metric that keeps you honest, and act on a result that comes back inconclusive.

 Craig Graham
Every few months a new feature arrives with the same promise: switch it on and the platform will find performance you could not find yourself. Broad match with Smart Bidding. Performance Max. Most recently, Google's AI Max for Search campaigns. The pressure to adopt is real, and the temptation is to flip it on, glance at the account a couple of weeks later, and declare it a winner or a dud.
That's what I would call vibe testing. It isn't a real, scientific test, because the results don't actually guide you to anything.
I treat a Google Ads experiment the way you would treat a proper scientific test: one variable, a control, a hypothesis written down before you start, and a result you are willing to accept even when you do not like it. Get that right and a boring feature teaches you more than an exciting one tested badly. Here is the method, and one worked example where the result was not the clean win everyone wanted.
Start With a Hypothesis You Can Be Wrong About
Before touching the experiment settings, write down (or type out) what you expect to happen and what would change your mind. Vague hypotheses ("this should improve performance") are untestable, because almost any outcome can be read as success after the fact.
A usable hypothesis names the metric and the direction. For an AI-driven expansion feature, mine usually reads: this should produce incremental conversions and conversion value, ideally at the same cost per acquisition (CPA, the cost to generate one conversion), and possibly at a higher one if the incremental volume justifies it. That sentence tells me exactly what to measure and what would count as failure: more spend and more clicks but no incremental value.
Design: Control Versus Treatment, Matched on Budget and Spend
Use the platform's own experiment framework rather than eyeballing before-and-after periods. Before-and-after comparisons are contaminated by seasonality, demand shifts, and every other change in the account. A split experiment runs control and treatment at the same time, on the same account, drawing from the same demand.
The most important design choice is what you hold constant. Match on budget, and by extension on spend, since budget is usually just a proxy for what actually gets spent. If the treatment arm is allowed to spend more, you cannot separate the effect of the feature from the effect of the extra budget, and almost any feature will "win" if you let it spend into more demand. Equal spend is what makes the comparison fair.
Then leave it alone. Every mid-flight edit adds additional variables that muddy the read.
Choose the Goal Metric Before You See the Data
This is where most tests quietly go wrong. If you decide what mattered after the numbers land, you will always find a metric that flatters the outcome. Clicks are up, so it worked. Or conversions held, so it was fine. Choosing your metric after the fact is how bad features get rolled out.
Decide up front which metric the decision rests on, and make it the one closest to revenue you can reliably measure. For an ecommerce (online retail) account, that is conversion value and conversions, not clicks and not impressions. Clicks and impressions are inputs. Revenue is the outcome. A feature that lifts the inputs while flattening the outcome is not helping you, however busy the dashboard looks.
A Worked Example: The Test That Refused to Give a Clean Answer
Here is a real one. The account is a high-spend ecommerce advertiser in the automotive accessories space, running well into six figures a month across Google. The campaign under test was one of the higher-spend non-brand Search campaigns. The feature was AI Max. Control versus treatment, matched spend, eight weeks.
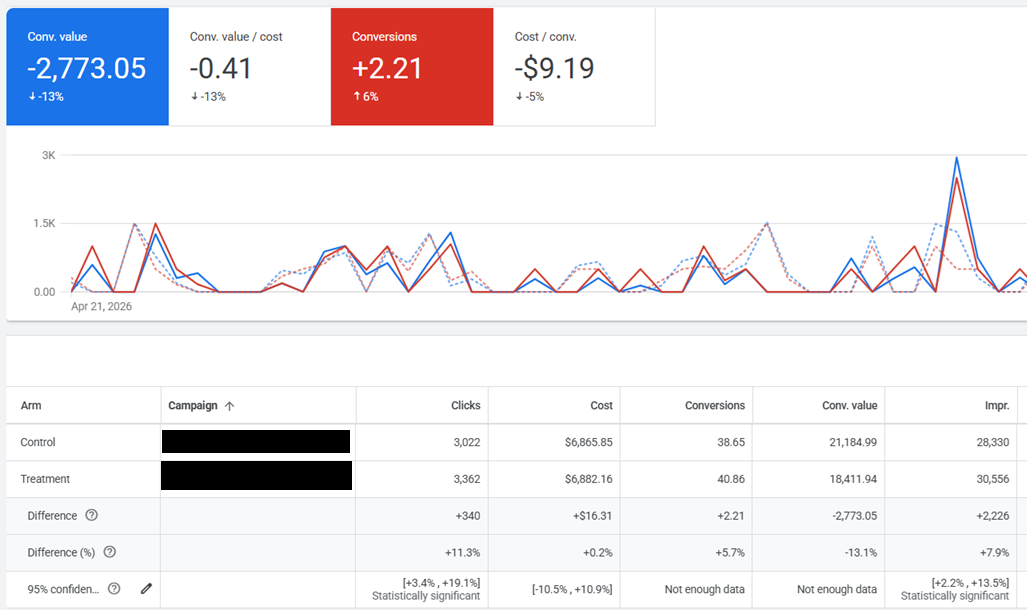
The result, on essentially identical spend:
AI Max experiment: control versus treatment, 8 weeks
| Metric | Control | AI Max | Difference |
|---|---|---|---|
| Impressions | 28,330 | 30,556 | +7.9% |
| Clicks | 3,022 | 3,362 | +11.3% |
| Cost | matched | matched | +0.2% |
| Conversions | 38.65 | 40.86 | +5.7% |
| Conversion value | 21,184.99 | 18,411.94 | -13.1% |
| ROAS | 3.09 | 2.68 | -13.3% |
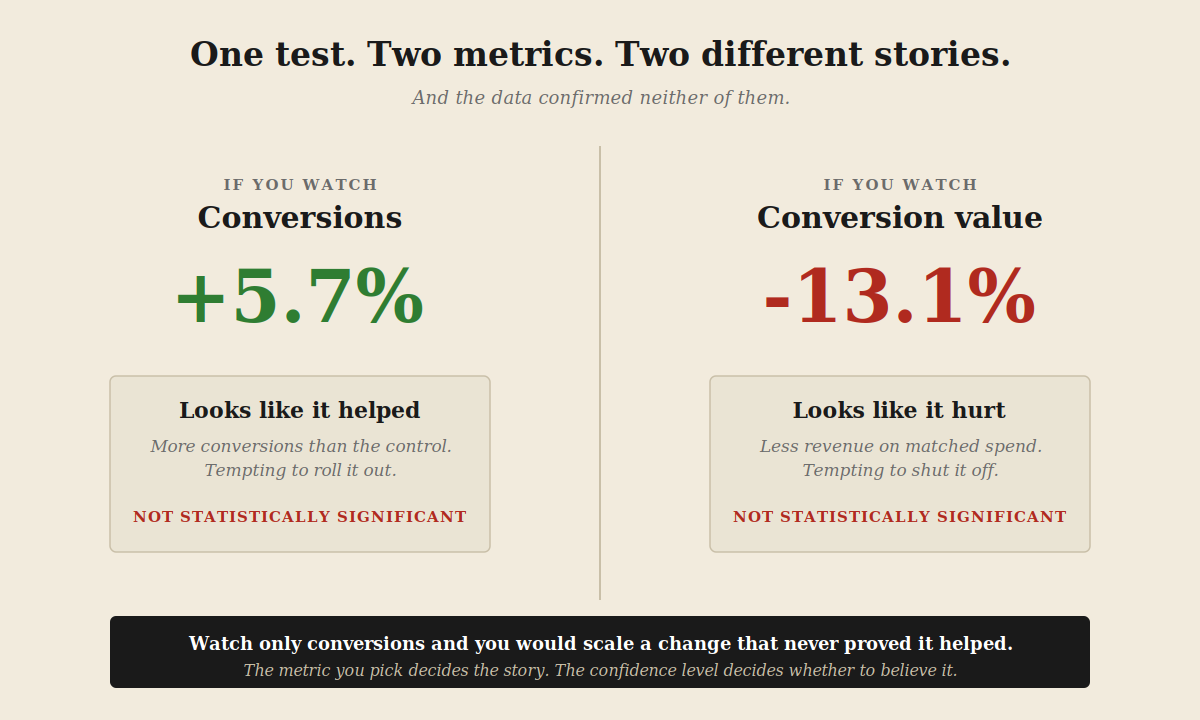
Read the top of that table and AI Max looks good. More impressions, more clicks, at a slightly lower cost per click. Read the bottom and the story inverts. Conversion value came in about 13% lower on the same spend. Conversions were nominally up, but by roughly two, and average order value fell, so on volume the two arms were effectively flat. More traffic came in, and it converted at lower value.
If I had set clicks as my goal metric, I would have rolled this out and quietly lost revenue. The goal metric I chose before the test is the only reason I read it correctly.
The Hardest Part: Acting on an Inconclusive Result
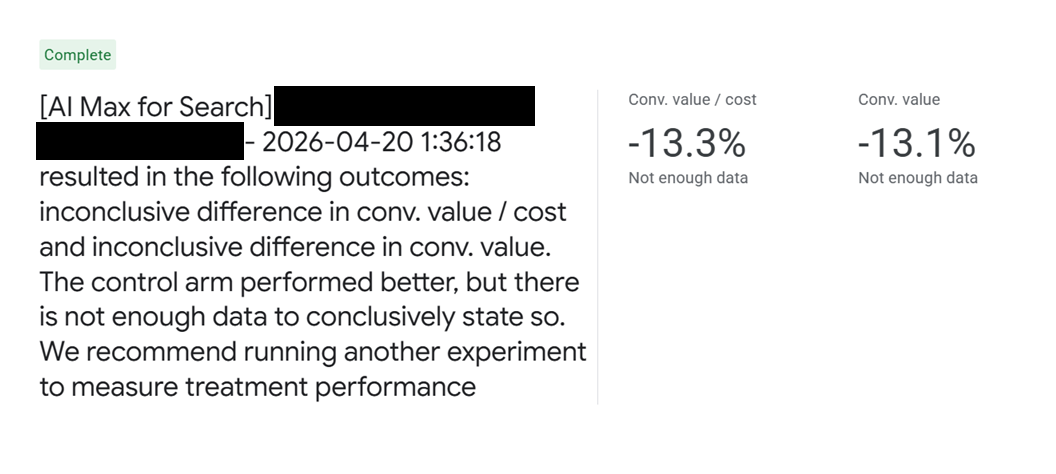
Here is the bit almost nobody writes about. This test did not reach statistical significance on its goal metrics. Google's experiment tool flagged the volume metrics, clicks and impressions, as significant, and left conversions and conversion value marked as not enough data, right to the end.
So I had no statistical proof that AI Max hurt revenue. I also had no evidence it helped. What I had was a directional signal, consistent across every weekly check, that the control arm held a revenue-quality advantage the whole way through.
Significance and confidence are not the same thing. An insignificant result does not mean "no difference." It means "not enough data to be sure." As a rule, I want to see roughly 90% to 95% confidence before I treat a result as real and act on it. That is not an iron law, there are edge cases where I would move on weaker evidence, for example when the downside of being wrong is small or the cost of waiting is high. But as a default, if the goal metric is trending the wrong way and the test cannot gather enough conversions to prove it either way, rolling out is a bet that the trend is noise. Leaving the control running is a bet that it is not. Given the direction of travel here, I left the control on and kept the account on standard Search. The absence of proof is not a reason to adopt.
Why the Result Probably Looked Like This
Worth saying, because it tells you when your own test might differ. This is a mature account with years of accumulated negative keywords and tight structure. The relevant query space is already well covered. Expansion features work by reaching into new queries, so on an account that has already mapped its territory, there is little incremental ground to find, and the extra reach tends to pull in lower-value traffic. On a younger or thinner account with genuine unmapped demand, the same feature could do the opposite. That is the point of testing rather than reading someone else's verdict, including mine.
The Checklist
Write a hypothesis that names the metric and direction. Use a matched-budget split experiment, not before-and-after. Choose your goal metric before you see the data, and make it the one closest to revenue. Do not edit mid-flight. And when the result is directional but short of roughly 90% to 95% confidence, treat "unproven" as a reason not to adopt, not a reason to adopt anyway.
None of this is exotic. It is just the difference between testing a feature and being marketed to by one. The platforms will keep shipping features with confident launch decks. A repeatable experiment method, and the discipline to act on an honest answer, is how you tell the ones that help your accounts from the ones that only look busy.
Frequently Asked Questions
- Do I need statistical significance to make a decision?
- No, but you need to know when you do not have it. Significance tells you how sure you can be that a difference is real. As a default I want to see about 90% to 95% confidence before I act on a result, though there are edge cases where a smaller downside or a high cost of waiting justifies moving on less. If a test cannot gather enough conversions to reach that bar, you are deciding under uncertainty either way, so let the direction of the goal metric and the cost of being wrong guide you. Not adopting is usually the lower-risk default.
- How long should a search experiment run?
- Long enough to gather a meaningful number of conversions on the goal metric, which matters more than calendar time. As a rough guide, on a high-conversion account I would not read anything into fewer than two weeks of data, and I would rarely run a test beyond about 60 days. A low-conversion account may never gather enough to say anything reliable, and sometimes that itself is the finding.
- Why match on budget and hold everything else constant?
- Because a valid experiment isolates one variable. The feature you are testing should be the only thing that differs between the two arms. That means budget, bids, targeting, creative, and every other setting need to stay the same across control and treatment. If any of those move, you cannot say whether the feature caused the difference or one of the other changes did. Budget matters to call out specifically because it usually acts as a proxy for spend, and unequal spend is the most common way an experiment gets quietly confounded, but the underlying rule is the same for every variable: change one thing at a time.